
If you went to veterinary school, you learned how to read bloodwork, radiographs, and a physical exam. Nobody taught you how to read a profit and loss statement.
That’s not a knock on you. It’s just not part of the curriculum, even though the P&L is one of the most important documents you’ll look at every month as a practice owner.
At Terrain, helping vets actually understand their numbers is the reason we do what we do. So this is a plain-English walkthrough of the P&L, using a real sample statement so you’re not just reading about it in the abstract. Whether you work with a bookkeeper like us or not, our hope is that by the end of this, your monthly P&L stops feeling like a document full of noise and starts feeling like something you can actually use.
What a P&L Is, Top to Bottom
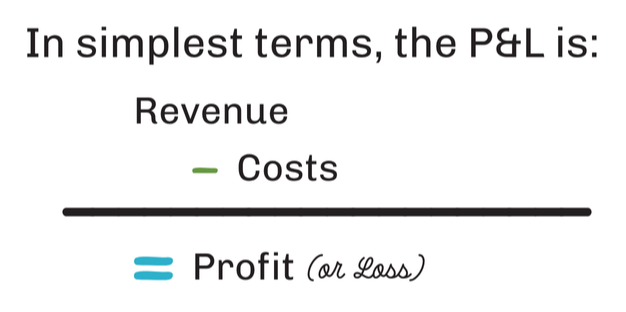 A veterinary practice profit and loss statement (P&L for short, or sometimes called an “income statement”) follows the same basic idea no matter what software your practice uses to generate it: revenue comes in, costs are subtracted in stages, and what’s left is the result.
That result is either a profit or a loss, which is where the statement gets its name.
The costs themselves (things like supplies, labor, and rent) aren’t “losses” on their own. They’re simply what gets subtracted along the way.
The costs get subtracted in two main stages:
- First, the direct cost of providing care comes out to arrive at gross profit.
- Then the other costs of running the practice come out to arrive at net profit.
Let’s walk through exactly what that looks like using a real example.
Here’s a Sample P&L
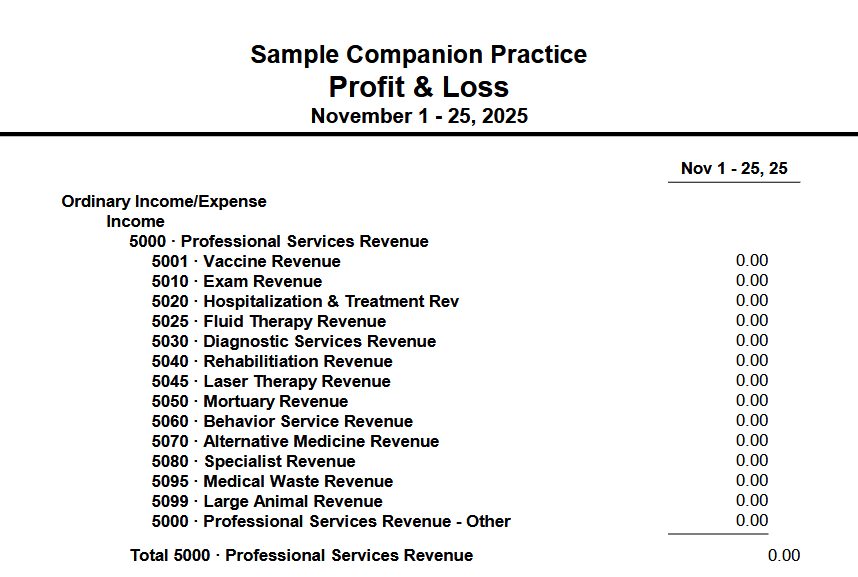
Click this image open the AAHA Sample P&L
Rather than describe all of this in the abstract, it’s easier to look at an actual P&L and walk through it together.
The American Animal Hospital Association (AAHA) publishes an updated sample companion-practice P&L based on the VMG/AAHA Chart of Accounts, making it a useful reference for seeing how a veterinary practice’s financial information can be organized.
Your own P&L almost certainly won’t look identical to this sample. Every practice’s bookkeeping setup is a little different. But the overall shape, and many of the categories, will look familiar.
Pull it up alongside this post if you’d like to follow along on your own statement as we go.
Walking Through It
Revenue or “Income”
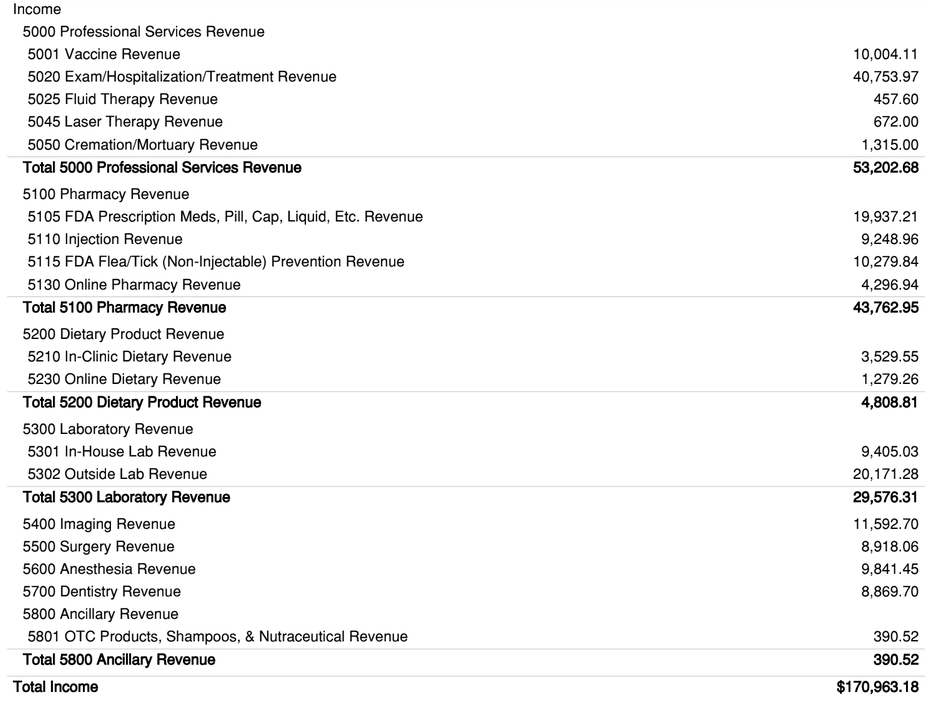
Near the top of the sample P&L, you’ll see revenue broken out by service category (wellness, surgery, dental, boarding, and so on) rather than lumped into one number.
How finely the revenue gets split out depends on the bookkeeping system and chart of accounts your practice uses, so don’t worry if your own revenue section looks more or less detailed than the sample. That’s a setup difference, not automatically a red flag.
Cost of Goods Sold (COGS)
Just below revenue/income, you’ll find COGS, or Cost of Goods Sold. This covers costs directly tied to delivering care, such as medical supplies, drugs, and lab fees.
At Terrain, we typically look for COGS to fall in the range of 20% to 25% of revenue.
If a number in this section looks a little different from what you expected, it may be a categorization choice rather than a mistake.
Gross Profit and Gross Profit Margin
In the sample P&L, right after the COGS section, you’ll see “Total COGS,” followed by “Gross Profit.”
That’s the formula in action:
Gross Profit = Revenue − COGS
Gross profit tells you what’s left after the direct costs of care are covered, before the other costs of running the practice are subtracted.
Here’s something worth noticing: the sample P&L shows gross profit as a dollar figure, not a percentage. That’s where gross profit margin comes in.
Gross profit margin expresses gross profit as a percentage of revenue rather than a raw dollar amount.
 Here’s why the percentage matters so much: a hypothetical $150,000 in gross profit means something very different depending on whether it came from $200,000 in revenue (a 75% margin) or $600,000 in revenue (a 25% margin).
The percentage gives you context that the dollar amount alone can’t.
Because percentages account for the size of the practice, they’re much more useful for judging performance and comparing results over time.
To calculate gross profit margin, divide gross profit by revenue.
You’ll often see this shortened to just “gross margin.”
In conversation and in bookkeeping software, they mean the same thing.
At Terrain, we typically look for a gross profit margin in the 75% to 80% range.
 This is also a good moment to clear up something that trips up a lot of practice owners:
gross profit and net profit sound similar, but they’re actually two different checkpoints in the same calculation.
Gross profit is calculated before operating expenses are subtracted.
Net profit is calculated after.
They’re not two words for the same thing.
Operating Expenses
Below gross profit, the sample P&L moves into its “Expense” section. This is where you’ll find operating expenses: the costs of keeping the practice running day to day, separate from the direct cost of care.
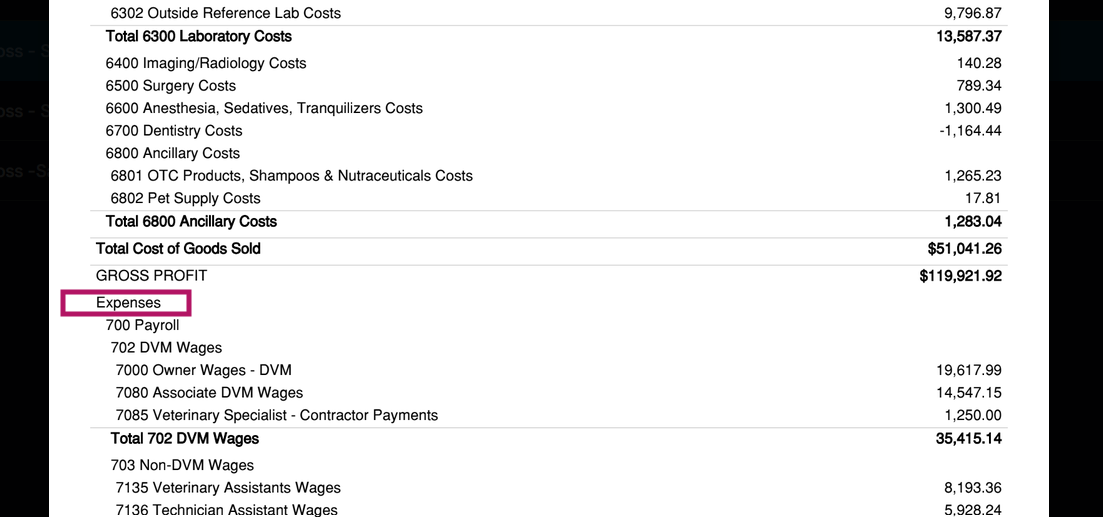 You’ll see categories such as compensation, facilities, administrative costs, and advertising.
At Terrain, we typically recommend these benchmarks:
- Labor: 40% to 50% of revenue
- Facilities: under 10%
- Administrative costs: around 5%
- Advertising: 1% to 5%
You’ll also notice that this sample is organized in a very specific, detailed way, right down to individual line items like “Registered Technicians Comp” and “Utility Services.”
That level of detail comes from something called a Chart of Accounts (COA).
Think of the COA as the master list of categories that transactions are sorted into.
It’s what helps determine how a P&L is organized in the first place.
The sample uses the VMG/AAHA Chart of Accounts, a veterinary-specific standard.
Using standardized categories helps practices classify financial information consistently, which makes financial data easier to compare over time and across practices. It also helps make industry benchmarking more meaningful because practices are reporting financial information using the same basic categories.
That consistency can be especially useful for practices participating in veterinary benchmarking and reporting through organizations such as Veterinary Management Groups (VMG).
The VMG/AAHA COA isn’t the only chart of accounts a practice can use. But it is a veterinary-specific standard, and it’s one reason two practices’ P&Ls may look very similar… or noticeably different.
One more thing worth knowing about this section: if you’re an owner who also works in the practice as a Doctor of Veterinary Medicine (DVM), the way your compensation is recorded can affect what you see on the P&L.
That means two otherwise similar practices can show different profitability numbers for reasons that aren’t necessarily related to how well either practice is being run. It’s one more reason to look at the whole picture rather than judging a practice by one number alone.
Net Ordinary Income and Net Profit Margin
Near the bottom of the operating portion of the sample P&L, you’ll see “Total Expense” followed by “Net Ordinary Income.”
Net Ordinary Income = Gross profit − operating expenses
Net Ordinary Income is the result of the practice’s ordinary operating activity after COGS and operating expenses have been subtracted.
This is an important number because it gives you a picture of how the practice is performing through its normal operations.
But there’s a little more to the sample P&L after Net Ordinary Income.
Below it, you’ll see sections for Other Income and Other Expenses, followed by the final Net Income.
We’re not going to dive deeply into those sections here. They can include items that aren’t part of the practice’s ordinary day-to-day operations, such as interest income or owner’s life insurance expense, and understanding every line isn’t necessary to learn the basic structure of a P&L.
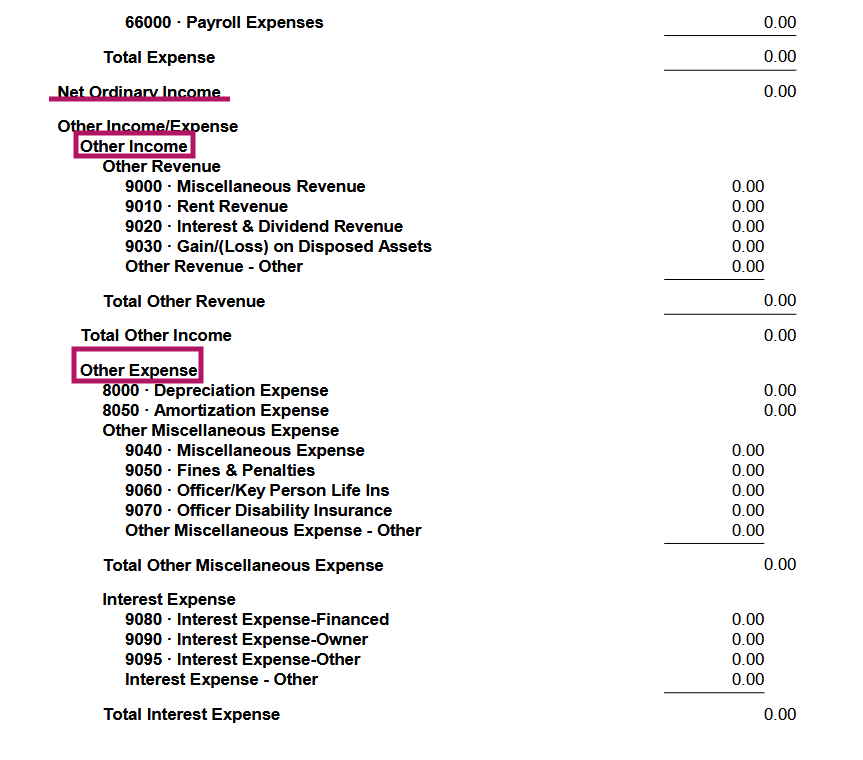 For now, the important thing to know is that:
- Net Ordinary Income shows the result of the practice’s ordinary operations
- Net Income is the final result after the additional income and expense items below it are included.
You don’t need to understand every line below Net Ordinary Income before you can start getting useful information from your P&L.
Just like gross profit, net profit is shown as a dollar figure.
And just like gross profit, that dollar amount doesn’t tell you much without knowing the size of the practice.
That’s where net profit margin comes in.
Net profit margin expresses net profit as a percentage of revenue.
It isn’t necessarily shown directly on the P&L, so you’ll need to calculate it by dividing net profit by revenue. You may also see this shortened to “net margin.”
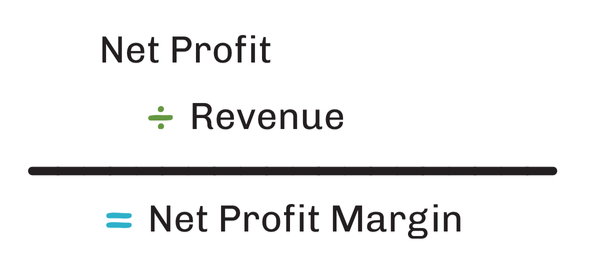 At Terrain, we typically look for a net profit margin in the 10% to 20% range.
A hypothetical $40,000 in net profit is a very different story if it came from $200,000 in revenue than if it came from $2,000,000. Always put the number in context by looking at it as a percentage of revenue before deciding whether it’s good, concerning, or somewhere in between.
Three Things to Check Every Month
You don’t need to analyze your entire P&L line by line every month to stay on top of things. Here are three habits worth building:
Check your gross and net margins against the benchmarks above.
A quick gut check each month can tell you whether you’re trending in a healthy range or drifting.
Scan for anything that moved significantly from last month.
A sudden jump in any category is worth a second look, even if the overall bottom line still looks fine.
Compare against your own history, not just the benchmark.
Your practice’s own trend line, month to month or year over year, often tells a more useful story than a single month held up against an industry number. Seasonality and one-time expenses can swing a single month in ways that don’t reflect how the practice is actually doing.
What the Numbers Are Telling You
A P&L isn’t just a record of what happened.
It’s a set of clues about what’s going on underneath the surface.
A few common patterns:
- If your COGS creeps up toward 30% instead of sitting in Terrain’s recommended 20% – 25% range, it might mean drug or supply costs are rising faster than your pricing, or that inventory isn’t being managed as tightly as it could.
- If your labor costs sit comfortably within the 40% – 50% percent range but your net profit margin is still lower than expected, the issue may not be labor at all. It could be pricing, or a facility or administrative cost that has crept up without much notice.
- If your gross margin looks healthy but your net profit doesn’t, the gap usually lives somewhere in operating expenses. That’s exactly why it’s worth checking both numbers rather than just the bottom line.
 When Something Looks Off
 When Something Looks Off
If your P&L says the practice was profitable this month, but your bank account doesn’t seem to reflect that, you’re not imagining things.
A P&L and a bank account are measuring different things.
The sample P&L we’re using is prepared on an accrual basis, which means revenue and expenses are generally recorded when they’re earned or incurred rather than when cash actually changes hands.
That timing difference is one reason the profit shown on a P&L won’t necessarily match what’s sitting in the bank account.
It’s also worth remembering that a busy practice doesn’t always mean a profitable one.
Revenue measures activity. Profit measures the result. Cash flow measures timing.
A P&L that looks fine on the surface can still be hiding a pricing problem, a staffing inefficiency, or a timing issue underneath. That’s why it’s worth reading past the bottom line every month rather than glancing at it and moving on.
What Your P&L Doesn’t Tell You
By now you’ve probably noticed a pattern: nearly every benchmark in this post—gross profit margin, net profit margin, COGS as a percentage of revenue, labor as a percentage of revenue—requires you to do a calculation the P&L itself may not perform.
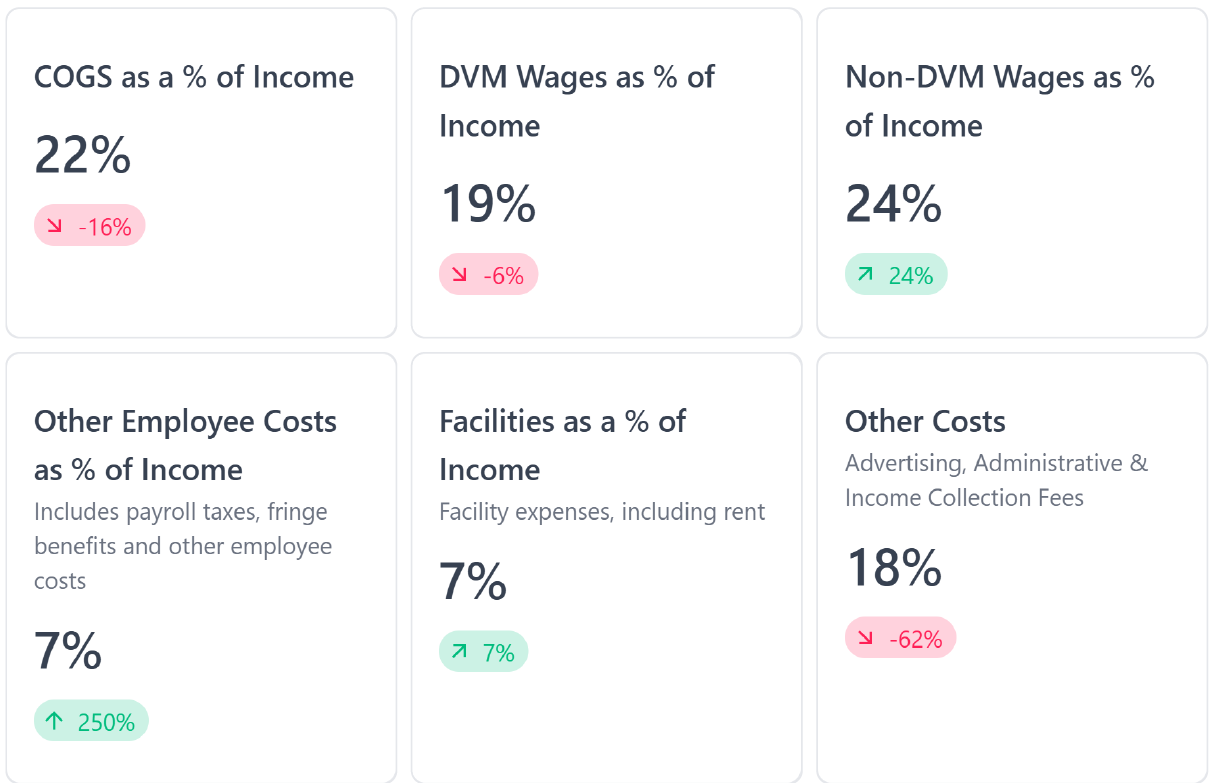
The statement shows dollar totals by category. Turning those numbers into percentages that tell you more about how the practice is performing takes an extra step.
The P&L leaves some things out entirely, too.
- It won’t show you your practice’s actual cash position.
That’s found on your Balance Sheet, but that’s for a separate blog post. - It won’t show you how much money clients currently owe you or how much you owe vendors.
That information lives on the Balance Sheet as well. - And it won’t show you every vet-specific performance metric you might want to track, such as revenue per DVM or your staff-to-DVM ratio.
Those come from KPIs and other reporting rather than the P&L itself.
None of that makes the P&L less useful.
It just means the P&L is one piece of the picture rather than the whole thing.
If you want that fuller picture without doing the math by hand every month, that’s part of what higher-tier Terrain plans include: metric cards and charts that surface these calculations for you automatically alongside your monthly financials.
Want a Second Set of Eyes on Your Numbers?
If reading your own P&L still feels more like guesswork than clarity, we’d be glad to help.
Schedule a Discovery Call or a Diagnostic Review with Terrain, and we’ll walk through your practice’s numbers together. No pressure, no obligation.
Terrain Bookkeeping is a boutique bookkeeping firm and is not a CPA firm. We do not provide tax advice or income tax preparation services.